When people ask “How much should I spend on marketing?”, the real answer is: it depends on your goals and how fast you want to grow.
This Bottom-Up Budget Model focuses specifically on marketing channels where you pay directly for leads, such as Google Local Service Ads (GLSA), HomeAdvisor, Angi, or similar “pay-per-lead” platforms. In these channels, Google (or the platform) may tell you how much a lead costs, but they do not tell you:
- How many leads you need to hit a revenue goal
- How many customers those leads will convert into
- How much revenue those new customers will generate
- Whether the investment aligns with your growth goals
- Or what your real ROI might look like
That’s what this calculator is designed to estimate. It takes inputs you already know or can reasonably estimate — like your close rate, revenue per job, customer retention, and margin — and works bottom-up to show:
- How many leads you need per month to reach your revenue targets
- How much budget that lead volume requires
- What your customer acquisition cost (CAC) looks like
- And your estimated ROI over 1, 3, and 5 years
This is one of several marketing forecasting frameworks — and none of them are perfect. Marketing has nuance: referrals, seasonality, branding, competition, offer positioning, and reputation all influence outcomes. But this model gives you a realistic baseline to budget from, grounded in math rather than guesswork.
We also work with many businesses who are on the smaller side — often investing $750–$2,500/month. And while we can often generate leads and even good ROI at those levels, the results sometimes don’t move the business forward fast enough to match growth expectations. This calculator helps make that visible early, so you can confidently decide:
- Whether your current budget supports your goals
- Or whether we need to scale up, pace differently, or focus on more affordable awareness channels first
It’s okay if the numbers feel big. Growth always looks big when you break it into its real components.
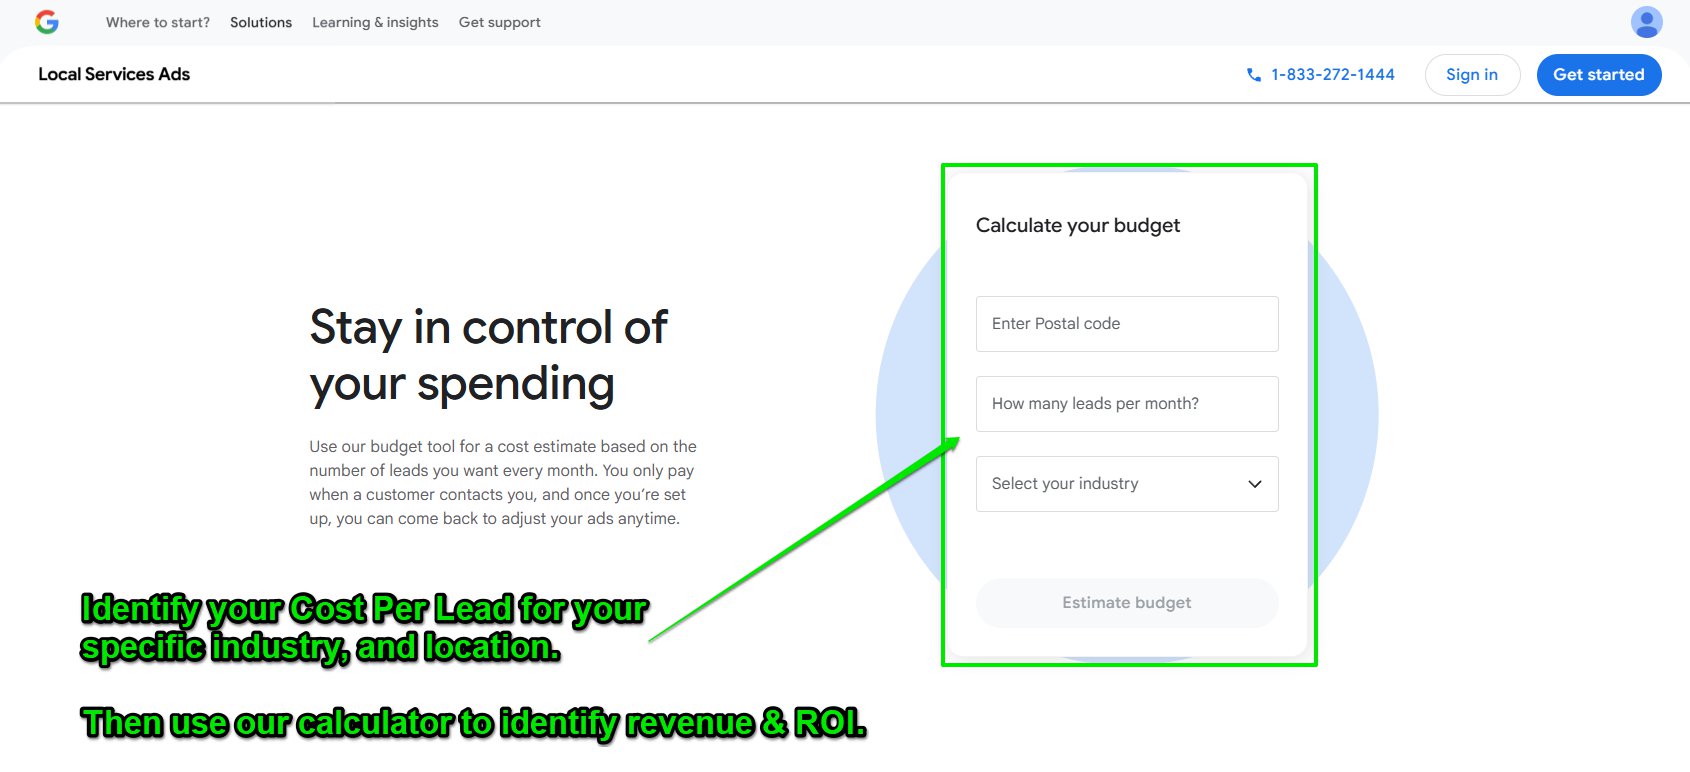
Identify Your Cost Per Lead
Estimated ROI of Pay Per Lead Programs – like Google LSA’s (Local Service Ads)
Local Services Ads: Finding a Realistic Cost-per-Lead (CPL)
Google Local Services Ads (LSA) show real-time, auction-based pricing for leads in your industry + service area. Because pricing is driven by supply/demand (competitors, time of day, reviews, proximity, and job type), the CPL estimates you see are a credible proxy for what similar businesses are currently paying.
How to get your CPL estimate (fast)
-
Open Google Local Services Ads and start a campaign setup.
-
Pick your business category (e.g., plumber, roofer, lawyer) and define your service areas (ZIPs/cities).
-
Add the job types/services you want (these can carry different CPLs).
-
Google will display an estimated cost per lead range for your selections.
-
Save the midpoint (or a conservative upper bound) as your working CPL for forecasting.
Why LSA CPL is useful for budgeting
Why LSA CPL is useful for budgeting
Auction-driven & dynamic: Reflects what advertisers are paying now, not last year’s benchmarks.
Geo-specific: Changes by metro/ZIP, so it’s more accurate than national averages.
Intent-filtered: You only pay for qualified calls/messages that meet Google’s lead criteria.
Scenario-friendly: You can test different service areas and job types to see how CPL shifts.
Tips to use LSA CPL in the calculator
Pick a cautious CPL (upper end of the range) to avoid under-budgeting.
Match your job mix: If you only take high-value services, use the CPL tied to those job types.
Update regularly: Re-check CPL monthly or quarterly—markets move.
Pair with your data: If you’ve run LSA before, blend Google’s estimate with your actual CPL.
What can change your CPL
Competitor density & bid pressure in your service area
Star rating, review volume, and response times
Scheduling/availability and hours (after-hours often costs more)
Seasonality and local demand spikes
Why LSA CPL is useful for budgeting
Plugging into the Bottom-Up Calculator
Enter the CPL you pulled from LSA.
Add your lead goal and close rate to see the required monthly budget.
Optional: include average revenue and margin to visualize profit & ROI over time.
Note: LSA CPL is a strong starting point, but it’s still an estimate. Use it to set realistic guardrails, then refine with your actual campaign data as results come in.
Bottom‑Up Growth Model — Marketing Budget & ROI Calculator
Pick a business category (auto‑fills a typical estimated CPL you can edit), set your lead goal and close rate. Optionally add revenue & margin to see ROI.
About the CPL data: Seeded from reputable industry benchmark studies (e.g., WordStream/LocaliQ/First Page Sage/Cognism) and shaped by typical SMB ranges. Replace with your own figures anytime.
Understanding the Inputs
| Input | What It Means | Why It Matters |
|---|---|---|
| Business Category | Select the general type of work you perform. (This is not dynamic) | Different industries have different market-average lead costs. See Google Local Service Ads to measure estimated cost per lead in your area. |
| Estimated CPL (Cost Per Lead) | How much you pay for one qualified lead. Editable for your real data. | CPL determines how far your marketing dollars go — lower CPL = more lead volume for the same spend. |
| Target Leads / Month | The number of new leads you want each month. | This is the starting point of your revenue growth model. |
| Close Rate (%) | Percentage of leads that convert into paying customers. | Conversion efficiency varies widely by business — this number has huge impact on ROI. |
| Revenue Type | One-time job vs. recurring monthly vs. annual contract. | Recurring revenue dramatically changes customer lifetime value. |
| Average Revenue per Customer | What you typically earn per new client. | Higher revenue per customer can justify higher lead costs. |
| Gross Margin (%) (optional) | How much profit you keep after delivering the service. | This determines whether your marketing is actually profitable. |
| Retention (months) (optional) | How long a recurring client stays with you. | Retention is often the biggest driver of long-term ROI. |