
How Much Should I Spend on Marketing?
We get this question all the time — and the honest answer is: it depends. Marketing isn’t just paying for leads. It also drives:
- Brand awareness and trust
- Reputation and credibility
- Referrals and word-of-mouth
- Long-term demand, not just short-term sales
- And yes — how much time and energy you save by not doing everything yourself
So there isn’t a single “right” number for every business. Different industries, growth stages, customer lifecycles, and competitive landscapes require different approaches. Marketing strategy is more nuanced than plugging numbers into a lead formula.
But there are useful budgeting frameworks — and one of the most reliable is the Percentage of Revenue model.
It won’t replace your strategy — but it provides a data-informed starting point for planning realistic, sustainable marketing investment.
Percentage of Revenue Model (The calculator on this page)
Most stable, established businesses invest 7–12% of revenue into marketing
to maintain visibility, brand awareness, customer acquisition, and churn offset.
Businesses simply maintaining momentum may spend closer to 3–6%.
Businesses aggressively growing or competing in crowded markets often invest
13–22%+ in order to gain market share.
What this calculator does
This calculator helps you estimate your marketing budget based on:
- Where you are today (current annual revenue)
- Where you want revenue to go (target annual revenue)
- How quickly you want to get there (time horizon)
- How aggressively you want to grow (Maintain · Established · Aggressive posture)
How to Use the Marketing Budget % of Revenue Calculator
This calculator helps estimate an appropriate monthly marketing budget based on your business’ revenue goals and growth posture. It also shows how that budget translates into lead flow, new customers, and expected revenue return.
See below the calculator for a more detailed explanation
How to Use This Marketing Budget Calculator
This calculator helps determine a healthy monthly marketing budget based on your revenue goals, how quickly you want to grow, and what each new customer is worth to your business. It also estimates how that budget translates into leads, customers, and revenue return.
1) Revenue & Growth Goal
| Field | What It Means | How to Use It |
|---|---|---|
| Current Annual Revenue ($) | Your revenue today across the last 12 months (or annualized run-rate). | Enter your current yearly number. |
| Target Annual Revenue ($) | The revenue level you want to reach. | Choose your next meaningful milestone. |
| Time Horizon to Target (months) | How quickly you want to achieve that target. | Shorter timelines require more investment to accelerate growth. |
2) Budget % Basis (How Your Marketing Budget is Calculated)
This determines which revenue number the marketing percentage applies to.
| Option | Use Case | Explanation |
|---|---|---|
| % of Current Revenue | Maintaining momentum | Spend is based on where the business is today. |
| % of Target Revenue (recommended for growth) | Scaling into a new level | Plans spend aligned with where you want to go. |
| % of Midpoint (avg) | Balanced, phased growth | Averages current + target to avoid under- or over-investment. |
3) Customer Economics
| Field | What It Means | Example |
|---|---|---|
| Revenue per New Customer ($) | The total value one new customer brings (one-time or total contract). | If someone pays $100/month for 12 months → enter 1200. |
| Gross Margin (%) | Profit remaining after cost of goods/services. | Higher margins support faster reinvestment into marketing. |
4) Lead & Conversion Inputs
| Field | What It Means | Notes |
|---|---|---|
| Cost per Lead (CPL) ($) | Average cost to generate one qualified inquiry. | If unsure, start with a reasonable industry estimate. |
| Lead → Customer Conversion (%) | % of leads that turn into paying customers. | If you close 1 out of 5 → 20%. |
| (Optional) CAC ($) | Customer Acquisition Cost per new customer. | If left blank, CAC auto-calculates from CPL & conversion. |
5) Growth Posture (How Aggressively You Want to Grow)
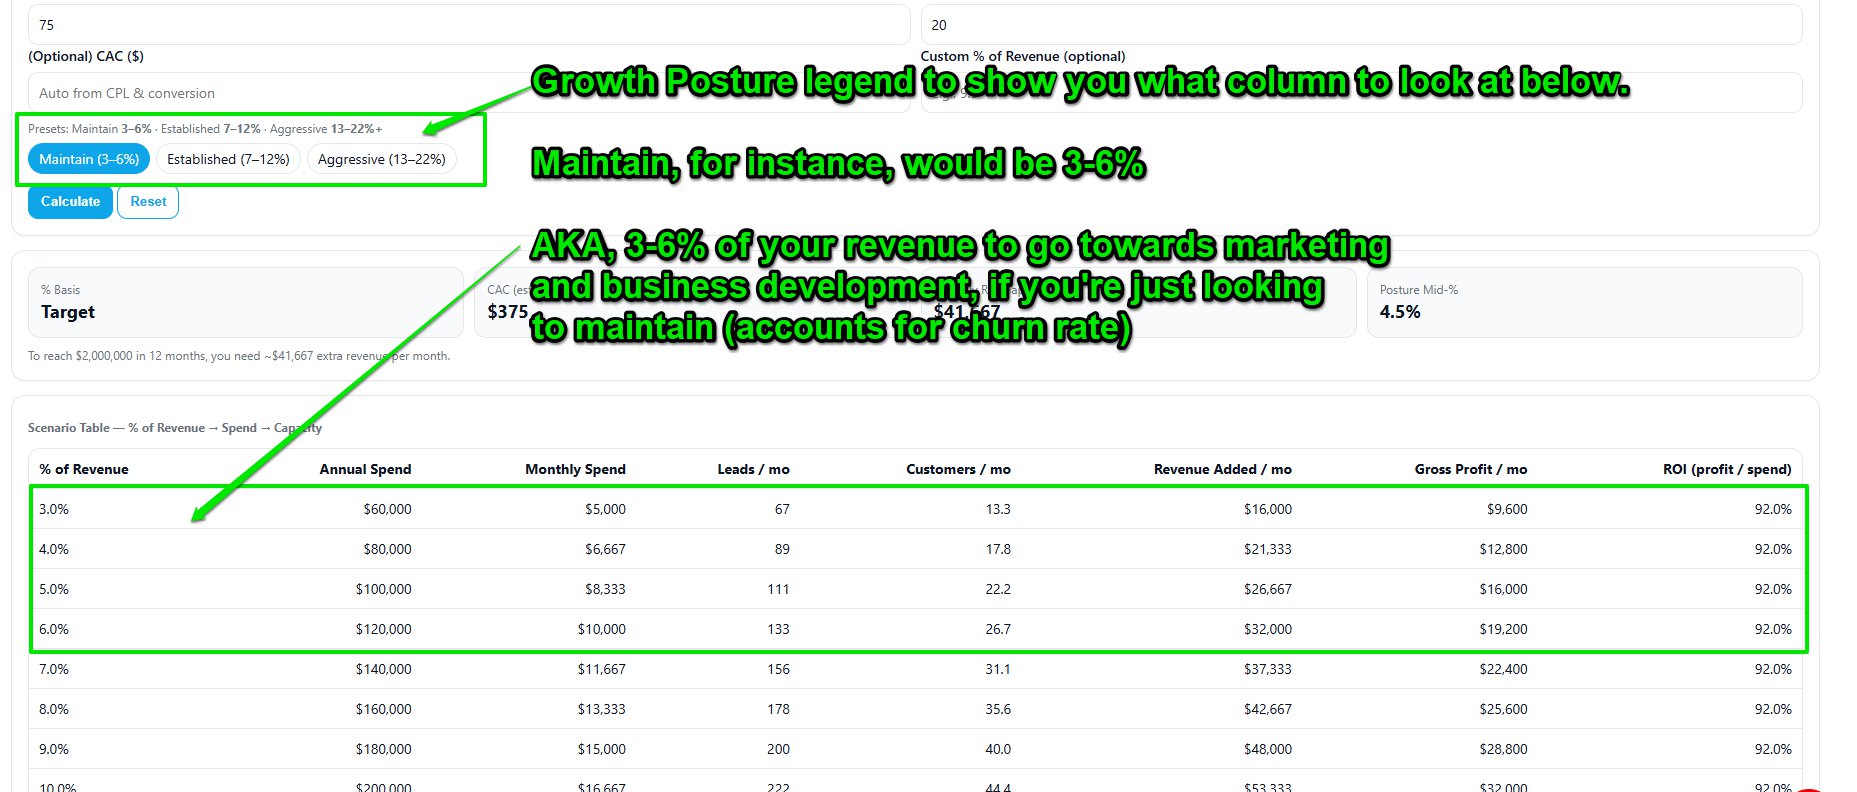 “Growth posture” refers to the strategic attitude a business takes toward growth — how aggressively it wants to expand versus maintain stability.
The percentage simply expresses how committed the business is to that growth posture. It may reflect things like:
-
How much of the budget is being invested into growth activities (e.g., marketing, sales, expansion) versus just maintaining operations.
-
The target growth rate the business is aiming for (e.g., revenue growth per year).
-
How heavily weighted investments are toward growth opportunities (similar to how investors allocate more of a portfolio to growth assets).
In short, the posture % shows how hard you’re pressing the gas pedal on growth.
| Posture | Typical % of Revenue | When to Use |
|---|---|---|
| Maintain | 3–6% | Stabilize revenue, offset churn, maintain visibility. |
| Established Growth | 7–12% | Steady demand growth & brand strengthening. (Most stable businesses are here.) |
| Aggressive Expansion | 13–22%+ | Competitive industries or fast market capture. |
| Custom % | Your choice | Use if you already know your desired allocation. |
KPI Summary (the block below the calculator)

| KPI | What It Means | Why It Matters |
|---|---|---|
| % Basis | Which revenue number your marketing % is being applied to (Current, Target, or Midpoint). | Aligns spend with where you are vs where you’re going. |
| CAC (est.) | Estimated cost to acquire one new customer (either entered manually or auto-derived). | Determines how many customers your budget can realistically drive. |
| Monthly Revenue Gap | How much new revenue per month is required to hit your target on your timeline. | This is the growth requirement your marketing strategy must support. |
| Posture Mid-% | The midpoint of your selected posture range. | A balanced, realistic spend level for consistent growth. |
Scenario Table (Spend → Leads → Customers → Revenue → ROI)
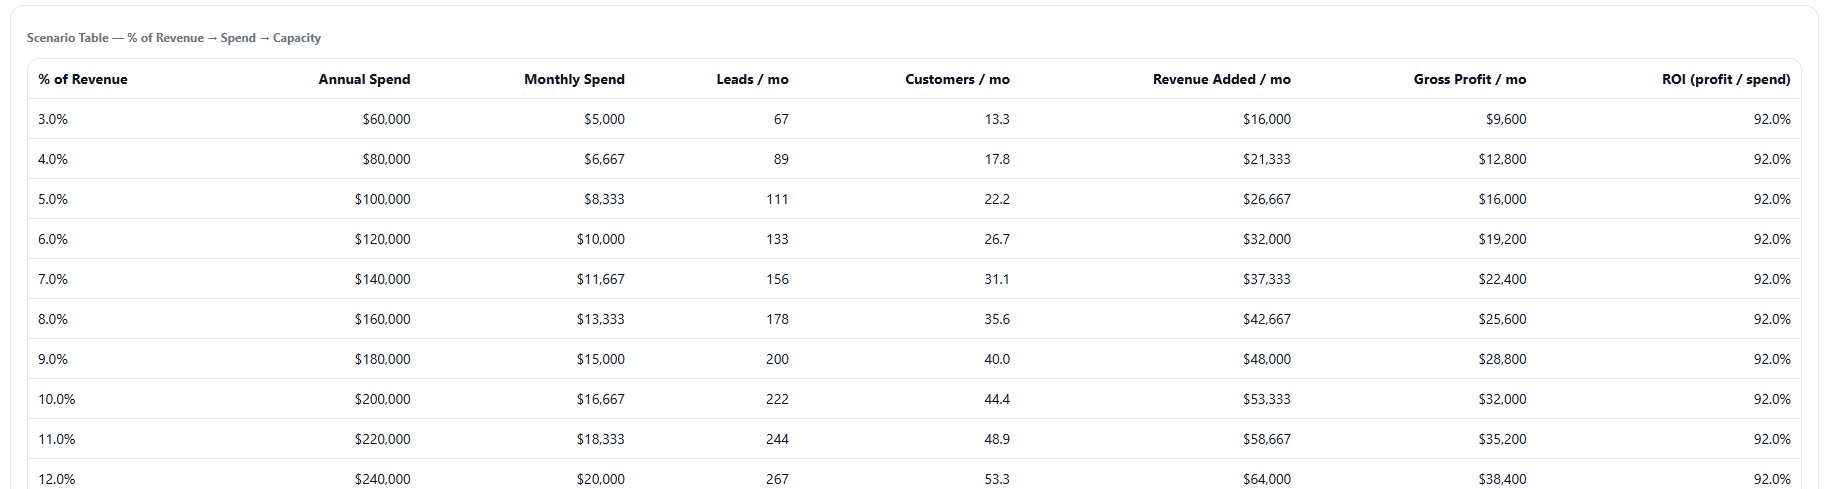 The table shows how different % of revenue allocations translate into:
-
Annual + Monthly Spend
-
Leads per Month
-
New Customers per Month
-
Added Monthly Revenue
-
Gross Profit
-
ROI (profit relative to marketing spend)
How to read it:
-
If Added Monthly Revenue ≥ Monthly Revenue Gap, your selected % supports your growth goal.
-
If it falls short, either:
-
Increase your % allocation, or
-
Extend your time horizon, or
-
Improve marketing efficiency (lower CPL / increase conversion).
-
Quick Interpretation Workflow
-
Choose your Budget % Basis and Growth Posture.
-
Look at Monthly Revenue Gap to know what you must achieve.
-
Use the Scenario Table to find the % where Added Monthly Revenue meets or exceeds the gap.
-
That % is your recommended sustainable growth marketing budget.